You Have Website Visitors, But Do You Know What They Do? GA4, Clarity and Looker Studio for Data-Driven Decisions
How to combine GA4, Microsoft Clarity and Looker Studio to understand what your visitors do, spot where they drop off and improve conversions with data.
Plenty of businesses know how many visitors their website gets. Far fewer know what those people do once they arrive: what they look at, where they hesitate, at what point they leave, and why they never get round to requesting a quote, booking or buying.
That's the difference between having traffic and having business opportunities.
In this article we explain how we combine three free tools (Google Analytics 4, Microsoft Clarity and Looker Studio) to go from "I think the website works" to "I know what's happening and what's worth changing".
Why one tool isn't enough
Each tool answers a different question. Using only one is like trying to understand a film by watching the credits.
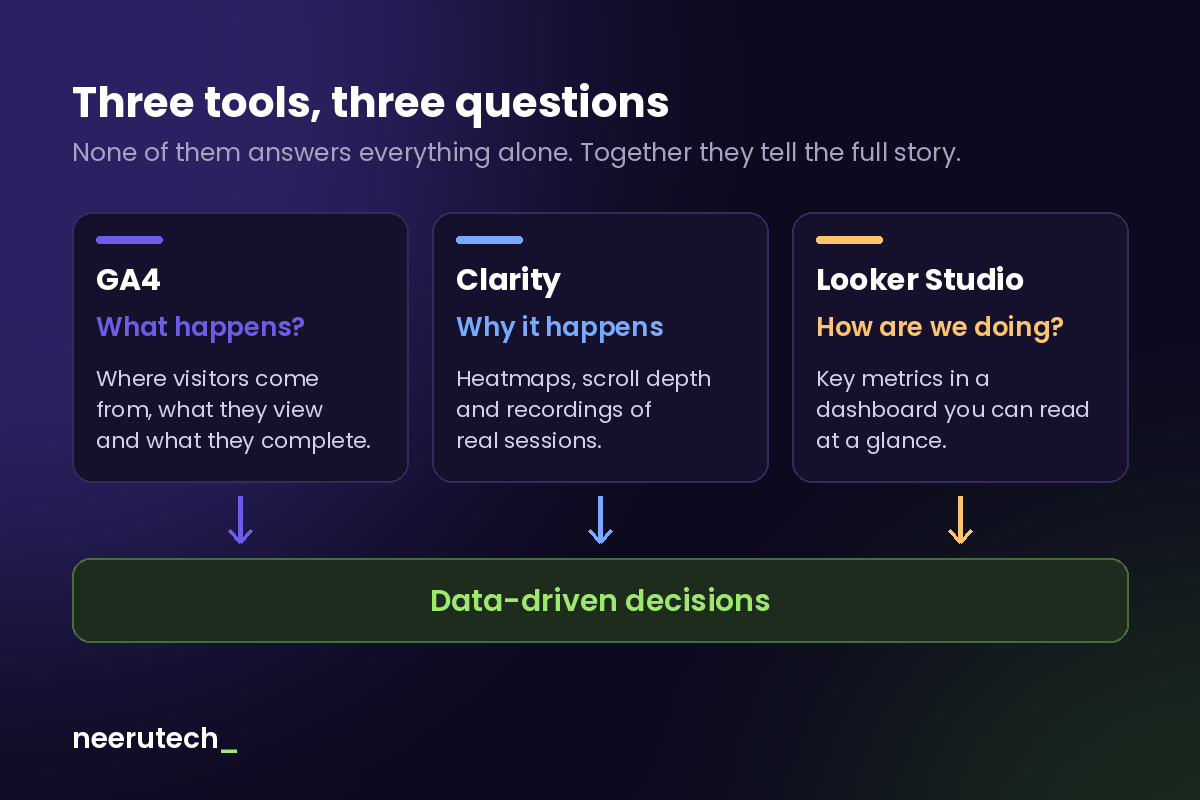
- GA4 tells you what happens: how many people arrive, where from (Google, social media, campaigns, links), which pages they view and how many complete the actions you care about.
- Clarity helps you understand why it happens: heatmaps, scroll depth, where people click, and recordings of real sessions showing how they navigate.
- Looker Studio tells you how you're doing: it brings the key metrics together in one clear dashboard, so you don't have to open three tools every time you want to check on the site.
GA4: measure what matters, not everything you can
The most common mistake with Google Analytics 4 is installing it and configuring nothing else. GA4 tracks visits and some interactions automatically, but it doesn't know what matters to your business until you tell it.
The first step is defining which actions count as success:
- Submitting a contact or quote form
- Clicking the phone number or WhatsApp
- Completing a booking or purchase
- Downloading a catalogue or document
These actions are set up as key events (what used to be called conversions). Without that step, GA4 gives you lots of numbers and very few answers.
It's also worth checking that campaign traffic arrives properly tagged. Otherwise everything ends up lumped together as "direct" or "unassigned", and there's no way to know which channel is working.
Microsoft Clarity: see your website through your visitors' eyes
GA4 tells you that 70% of people leave a page. Clarity helps you see why.
What we use most:
- Heatmaps: where people click and where they don't. Sometimes people click on elements that aren't links, or completely ignore the main button.
- Scroll maps: how far down they get. If your form sits at the bottom of a page almost nobody finishes, that's a clue.
- Session recordings: watching real (anonymised) visits is the fastest way to spot friction that numbers don't show.
- Frustration signals: rage clicks, dead clicks and quick backtracks.
A word of caution: recordings are useful, but you shouldn't draw conclusions from a single session. What counts is the pattern that keeps repeating.
Looker Studio: a dashboard you can read at a glance
Looker Studio connects to GA4 (and other sources, such as Google Ads or a spreadsheet) to build custom dashboards.
The key isn't adding lots of charts. It's showing the few metrics that answer the business's questions:
- How many useful visits arrive, and from which channel?
- How many end in a contact, booking or sale?
- Which pages generate the most opportunities, and which the most drop-offs?
- How is all this changing month to month?
A good dashboard can be read by anyone on the team, not just the person who built it.
Before you measure: consent
In Spain and the rest of the EU, analytics that rely on cookies or identifiers require user consent. This applies to GA4 and to Clarity.
That's why any serious setup starts with a cookie banner that actually works, plus Google's Consent Mode, which adjusts what GA4 records based on what each visitor has accepted.
Without it you have two problems: legal risk, and data you can't trust, because you don't know what share of your traffic you're actually measuring.
What we're doing with a client right now
We've been managing a large client's website for two years. Their business is very successful and the site gets a huge amount of traffic, but until now they had no detailed view of what happened on it or how many visits ended in a conversion. We'd been talking to them about the importance of measurement all along, and they recently approved the project.
It's an ideal case, because with that much traffic you can find reliable patterns, not conclusions drawn from a handful of visits. The work includes:
- Defining what a conversion is for their business and setting it up in GA4.
- Configuring consent so the data is reliable and compliant.
- Connecting Clarity to watch real sessions and heatmaps on key pages.
- Mapping the full funnel: how many people move from one step to the next until they sign up.
- Building a Looker Studio dashboard with the metrics that matter to them.
The challenge: when the conversion happens outside your website
Sign-ups aren't completed on the website but in external software that works almost like a black box: it doesn't allow tracking to be added.
Today we can measure how many people leave the website for that system, which is already a very useful signal, but not how many actually complete the sign-up. To close the funnel, we're looking at integrations that send that information back asynchronously so we can record the real conversion.
This is more common than it seems: booking engines, payment platforms and third-party registration systems. That's why, before promising conversion figures, it's worth checking where the conversion really happens and what data each system can provide.
We won't share client data or results we don't have yet. What we can share is the method, which is what makes the difference.
CRO is a cycle, not a change
CRO (Conversion Rate Optimisation) means getting more of your visitors to do what your business needs. And there's a lot of hype around it.
CRO isn't about changing buttons at random. It's about understanding, forming hypotheses, testing improvements and measuring results.
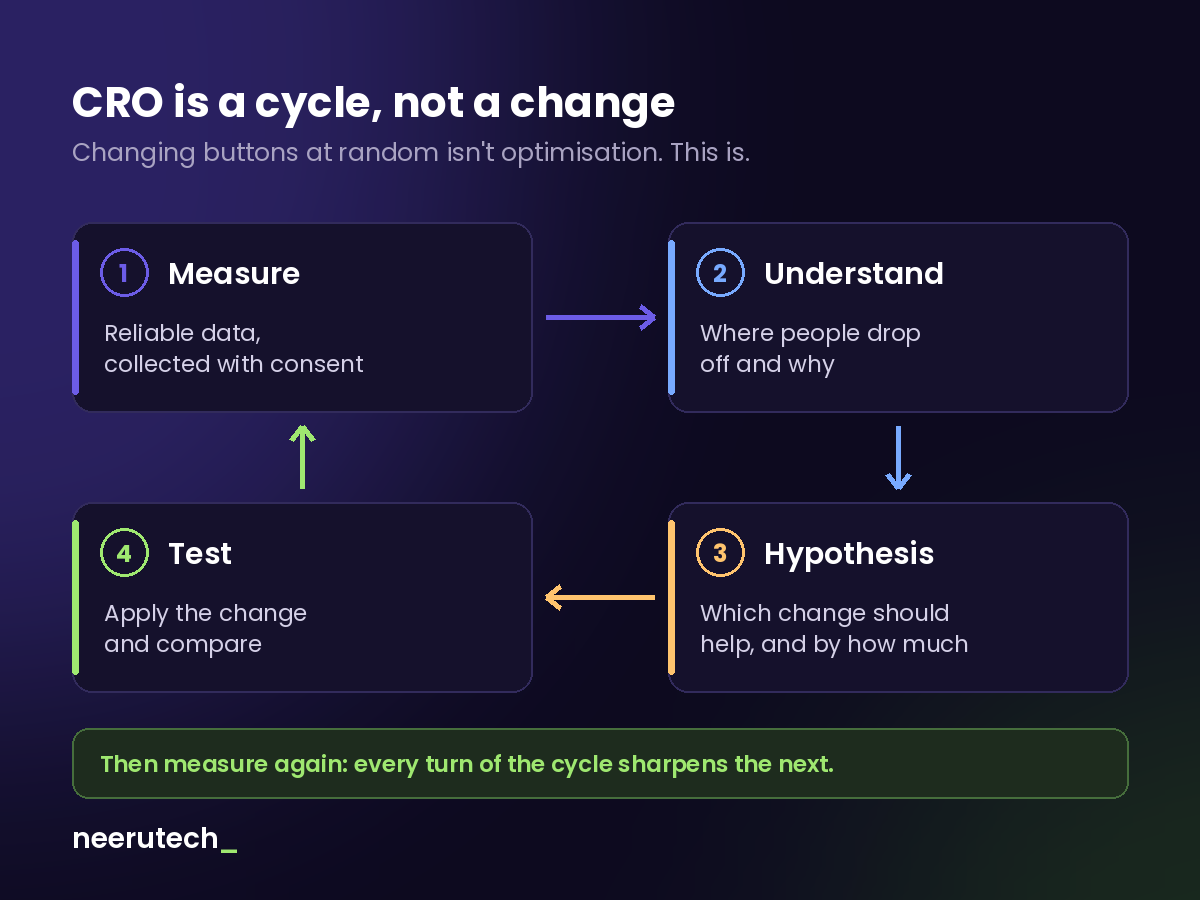
- Measure: reliable data, collected with consent.
- Understand: where people drop off and, thanks to Clarity, why.
- Hypothesis: "if the form asks for less information, more people will complete it".
- Test: apply the change and compare it with before.
Then measure again. Every turn of the cycle sharpens the next.
Some questions this cycle helps answer:
- Do visitors reach the form but not complete it?
- Do they abandon one particular page more than the rest?
- Are your campaigns attracting the right audience, or just adding visits?
- Is the mobile experience worse than desktop?
Conclusion
Getting visitors is the first step. Understanding what they do is what lets you improve.
With GA4, Clarity and Looker Studio properly set up, decisions about your website stop being based on hunches or on whoever argues loudest in the meeting, and start being based on what your customers actually do.
If you're interested in making sure all this runs on a solid website, you may find our article on what a small business needs to be ready when its website fails useful, or our comparison of WordPress vs custom development.
Frequently asked questions
Are these tools free? GA4, Microsoft Clarity and Looker Studio all have free versions that comfortably cover what a small business needs. The cost lies in setting them up properly and, above all, in analysing the data.
Does Clarity slow down the website? The script is lightweight and loads asynchronously. Even so, as with any third-party tool, it's worth checking performance after installing it.
Are Clarity recordings legal? Clarity masks sensitive data typed into forms by default, but you still need user consent and should mention it in your cookie policy.
How long does it take to draw conclusions? It depends on your traffic. With few visits you'll need several weeks to see reliable patterns; with plenty of traffic, less. What you shouldn't do is change things based on two days of data.
Do you know what percentage of your visitors end up doing what you need them to?
At Neerutech we set up your website's measurement end to end (events, consent, Clarity and Looker Studio dashboards) and help you interpret the data to decide what to improve. See how we work.
What do you use today to know what's happening on your website? Let us know in the comments.
Related articles
 Destacado
What a Small Business Needs to Be Ready When Its Website Fails
How to prepare your small business website for outages, attacks or human error: tested backups, monitoring, an incident plan and a clear recovery process.
 Destacado
When to Leave Excel Behind: Signs Your Business Needs Something Else
The signs your business has outgrown the spreadsheet, the three steps before commissioning custom software, and how to switch without breaking anything.
 Destacado
How Much a Website Costs for a Small Business in Spain
Orientative price ranges for a small business website in Spain, what drives the budget, what's usually included and what it costs to maintain each month.